Where do Brown students make friends?
- Apr 13
- 4 min read

By Eric Xia
In the latest poll by Brown Opinion Project (n=207), we found that the avenues through which Brown students make friends varies predictably across concentrations and class year. We identify some general results from crosstabulations, and then focus on race & concentration, which both appear to be important factors in making friends. We report results over class years, as there is significant variability between grades.
We couldn’t have published this report without an amazing community of pollsters. Do you want to support this kind of independent research in the future? Do you want to come up with important questions to improve your college and give back to your community? Join BOP today!
General Results
Making Friends by Venue
While these results suggest that student clubs dominate friend making at Brown, examination by class year will reveal more complicated relationships between avenues.


Academic community grows with time
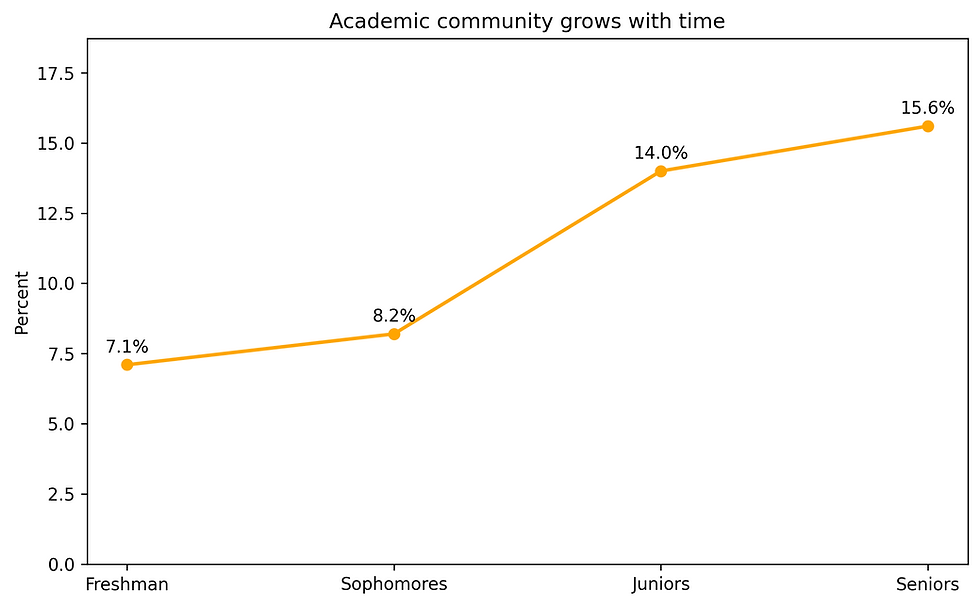
Orientation friend groups are not made to last
While a significant percentage of sophomores reported making the most friends through orientation (10%, n=5), 1 and 0 respondents out of juniors (n=43) and seniors (n=45), respectively, report the same. While this does not mean students do not make close friends during these events, it does indicate very few respondents stayed in touch with everyone from orientation.
Gender & Friendships
Overall, straight and LGBTQ+ friendships are quite similar. Less non-straight respondents reported making the most friends through sports or outdoor activities (6% vs 12%, n=4/72, n=14/121). Male and female responses were also quite similar. More women reported making friends through orientation (5% vs. 2%, n=5/102, n=2/94). No patterns were observed among the five non-binary respondents, with responses as Student Clubs (2), Academic Settings, Dorms, and Parties respectively.
Race and Making Friends
Who makes friends in Academic Settings?
Almost no BIPOC students at Brown reported an academic setting as their top avenue for making friends. Compared to 14% of Asian (n=13/89) and 10% of White (n=9/89) students selecting academics (e.g. classes, research, or TA programs) as their top venue, only 3% of Black respondents (n=1/38) did. Out of the twenty seven respondents not mentioned above, zero Hispanic or Latino (n=23), Middle Eastern or North African (n=3), Native American or Alaska Native (n=2) respondents reported academic settings as their top choice.
Race/Ethnicity | Count | % top Academic |
Asian | 13 | 14.6% |
White | 9 | 10.1% |
Black | 1 | 2.6% |
All others | 0 | 0.0% |
Who makes Friends through Student Clubs?
Student clubs are the primary friend-making venue for every racial group, but stand out for Hispanic or Latino and Black respondents. Note that this category excludes sports or outdoor activities, as a separate category provided to respondents.
Race/Ethnicity | Count | % top Student Clubs |
Asian | 30 | 33.7% |
White | 25 | 28.1% |
Black | 14 | 36.8% |
Hispanic or Latino | 9 | 39.1% |
Middle Eastern or North African | 3 | 100.0% |
Native American or Alaska Native | 1 | 50.0% |
Prefer not to answer | 1 | 33.3% |
Native Hawaiian or Pacific Islander | 0 | 0.0% |
More respondents in Social Sciences and Humanities/Arts (Humanities) reported making the most friends through Student Clubs and Parties and Social Events.
Who makes Friends at Parties or Social Events?
More Hispanic and Latino students report making friends at parties and social events than any other group. Compared to lower percentages among White (15%), Asian (11%), and Black (10%) students, 21% (n=5/23) Hispanic or Latino students reported having made the most friends at parties. Notably, this category likely excludes student club events or dorm socials, as they are covered by other categories.
Race/Ethnicity | Count | % Top Parties |
White | 13 | 14.6% |
Asian | 10 | 11.2% |
Hispanic or Latino | 5 | 21.7% |
Black | 4 | 10.5% |
Native American or Alaska Native | 1 | 50.0% |
Middle Eastern or North African | 0 | 0.0% |
Native Hawaiian or Pacific Islander | 0 | 0.0% |
Prefer not to answer | 0 | 0.0% |
Who makes Friends through Sports or Outdoor Activities?
Fewer Asian (n=6/89) and Hispanic or Latino (n=1/23) respondents reported making the most friends through sports or outdoor activities than other groups.
Race/Ethnicity | Count | % of Group |
White | 9 | 10.1% |
Asian | 6 | 6.7% |
Black | 5 | 13.2% |
Hispanic or Latino | 1 | 4.3% |
Other | 0 | 0.0% |
Concentration and Making Friends
STEM & Humanities freshmen find friends in the same places

STEM academic friend making grows rapidly over years
Life and Physical Sciences (STEM) are far more likely to report an academic setting as their top venue for making friends than other concentration areas. By senior year, one third of STEM respondents report making the most friends in academic settings, while 10% of Social Sciences, Humanities & Arts (Humanities) report the same.

Housing dominates senior year Humanities friendships

STEM friendships remain balanced over time

The Brown Opinion Project (BOP) conducted its March 2026 poll on March 10th, 11th, and 12th. BOP solicited responses from Brown undergraduate students near Faunce Hall and Sciences Park. BOP representatives asked every person who passed their location if they were interested in taking a quick anonymous poll. Responses were anonymously collected using Google Forms. Over the course of the polling process, BOP collected 207 total responses from Brown undergraduate students.
To estimate the statistics used above, the response "4 or more" was converted to 4. The total response body was 349 students.


Comments